Data visualization is an interdisciplinary field that deals with the graphic representation of data and/or information. It's thought to be a paticularly effective way of communicating large datasets, especially to more general audiences.
R&D in life science, material science, and chemistry is burdened by fragmented and unstructured data (“spreadsheet hell”), and ambiguous or unrecorded methodological data. Thi...
Gilles de la Tourette syndrome (GTS) is a neurodevelopmental disorder exhibiting both motor and behavioral impairment. Like most neuropsychiatric disorders, its pathophysiology has yet to be...
Clinical whole genome sequencing (cWGS) is rapidly gaining acceptance as cost is decreasing and success rates in identifying disease-causing variants are increasing. While the application of...
DATE: February 8, 2017TIME: 1:30pm PT, 4:30pm ETThe powerful and expanding use of genetically modified mice introduces important aspects of genetics in managing these strains for breedi...
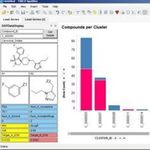
DATE: October 25th, 2016TIME: 9:00 AM PT, 12:00 PM ETTIBCO Spotfire is a powerful data visualization platform. Its functionality can be extended by creating custom tools. The...
DATE: May 17, 2016
TIME: 7am Pacific time, 10am Eastern time, 4pm Swedish time
Data generation is becoming easier and easier and many organizations have matured in their data storage and ...
Date: Dec 1, 2015 7:00am Pacific, 9:00am Central, 10:00am Eastern, 4pm European Time
Data generation is becoming easier and easier but within the fields of bioinformatics and data analysis...
Structure-based drug discovery requires expert designers, aided by software that integrates 3D structure visualization and molecular editing with multivariate experimentaland calculated prope...
Date: Wednesday, June 24th, 2015 Time: 09:00AM PDT, 12:00PM EDT, 4:00PM GMT Solaris™ is a new open-air fluorescence imaging system developed by PerkinElmer, enabling translational in vivo pre...
DATE: June 17th, 2015TIME: 8am Pacific time, 11am Eastern timeSpatial heterogeneity of tumors has been identified within and between metastatic lesions and can be visualized wit...
Biological datasets have become increasing large and complex. Knowledge databases and publicly available datasets are available for use in experimental planning and running results comparison...
DNASTAR offers an integrated suite of software for accurate assembly and analysis of sequence data from all major next-generation sequencing platforms supporting key workflows including targe...
Recent advances in noninvasive neuroimaging have set the stage for the systematic exploration of human brain circuits in health and disease. The Human Connectome Project (HCP) is systematical...
Dr. Oliver Kepp will be presenting on:Immunogenic cell death fingerprinting utilizing a high-throughput screening approachThe strategy of immunogenic cell death fingerprinting has been design...
Proteomics technology has improved dramatically over the last decade. The technology developments have largely been directed around instrument hardware, where instruments have been developed...
Within the field of bioinformatics, scientists and organizations struggle with multiple problems. Key problems are the large amount of data and that the people who understand biology (or che...
In this webinar, our expert panel of speakers will introduce the new EnSight™ Multimode Plate Reader from PerkinElmer and demonstrate how the unique combination of well-imagin...
In this webinar, our expert panel of speakers will introduce the new EnSight™ Multimode Plate Reader from PerkinElmer and demonstrate how the unique combination of well-imaging with lab...
We present a personalized medicine suite of software applications developed at UCSF for multiple sclerosis (MS): the MS Bioscreen. This new tool addresses the challenges of the dynamic manage...
During IVF procedures pre-implantation genetic diagnosis (PGD) allows for genetic profiling of embryos prior to replacement. Most PGD procedures during IVF are performed to select chromosomal...
R&D in life science, material science, and chemistry is burdened by fragmented and unstructured data (“spreadsheet hell”), and ambiguous or unrecorded methodological data. Thi...
Gilles de la Tourette syndrome (GTS) is a neurodevelopmental disorder exhibiting both motor and behavioral impairment. Like most neuropsychiatric disorders, its pathophysiology has yet to be...
Clinical whole genome sequencing (cWGS) is rapidly gaining acceptance as cost is decreasing and success rates in identifying disease-causing variants are increasing. While the application of...
DATE: February 8, 2017TIME: 1:30pm PT, 4:30pm ETThe powerful and expanding use of genetically modified mice introduces important aspects of genetics in managing these strains for breedi...
DATE: October 25th, 2016TIME: 9:00 AM PT, 12:00 PM ETTIBCO Spotfire is a powerful data visualization platform. Its functionality can be extended by creating custom tools. The...
DATE: May 17, 2016
TIME: 7am Pacific time, 10am Eastern time, 4pm Swedish time
Data generation is becoming easier and easier and many organizations have matured in their data storage and ...
Date: Dec 1, 2015 7:00am Pacific, 9:00am Central, 10:00am Eastern, 4pm European Time
Data generation is becoming easier and easier but within the fields of bioinformatics and data analysis...
Structure-based drug discovery requires expert designers, aided by software that integrates 3D structure visualization and molecular editing with multivariate experimentaland calculated prope...
Date: Wednesday, June 24th, 2015 Time: 09:00AM PDT, 12:00PM EDT, 4:00PM GMT Solaris™ is a new open-air fluorescence imaging system developed by PerkinElmer, enabling translational in vivo pre...
DATE: June 17th, 2015TIME: 8am Pacific time, 11am Eastern timeSpatial heterogeneity of tumors has been identified within and between metastatic lesions and can be visualized wit...
Biological datasets have become increasing large and complex. Knowledge databases and publicly available datasets are available for use in experimental planning and running results comparison...
DNASTAR offers an integrated suite of software for accurate assembly and analysis of sequence data from all major next-generation sequencing platforms supporting key workflows including targe...
Recent advances in noninvasive neuroimaging have set the stage for the systematic exploration of human brain circuits in health and disease. The Human Connectome Project (HCP) is systematical...
Dr. Oliver Kepp will be presenting on:Immunogenic cell death fingerprinting utilizing a high-throughput screening approachThe strategy of immunogenic cell death fingerprinting has been design...
Proteomics technology has improved dramatically over the last decade. The technology developments have largely been directed around instrument hardware, where instruments have been developed...
Within the field of bioinformatics, scientists and organizations struggle with multiple problems. Key problems are the large amount of data and that the people who understand biology (or che...
In this webinar, our expert panel of speakers will introduce the new EnSight™ Multimode Plate Reader from PerkinElmer and demonstrate how the unique combination of well-imagin...
In this webinar, our expert panel of speakers will introduce the new EnSight™ Multimode Plate Reader from PerkinElmer and demonstrate how the unique combination of well-imaging with lab...
We present a personalized medicine suite of software applications developed at UCSF for multiple sclerosis (MS): the MS Bioscreen. This new tool addresses the challenges of the dynamic manage...
During IVF procedures pre-implantation genetic diagnosis (PGD) allows for genetic profiling of embryos prior to replacement. Most PGD procedures during IVF are performed to select chromosomal...
Opens in a new windowOpens an external siteOpens an external site in a new window